Statistics by Tableau Desktop, Tableau Server and Google Analytics
- enigma77777
- 27 мая 2020 г.
- 1 мин. чтения
Обновлено: 28 мая 2020 г.

I have had a full joy to make and schedule Google Analytics reports for Confluence Wiki pages.
I used TableauDesktop for preparing data and had chance to upload new reports to TableauServer.
For personal interest i played with Coronavirus data taken from worldometers to figure out how harmful or not very harmful the world situation is, what countries had the best results and which not.
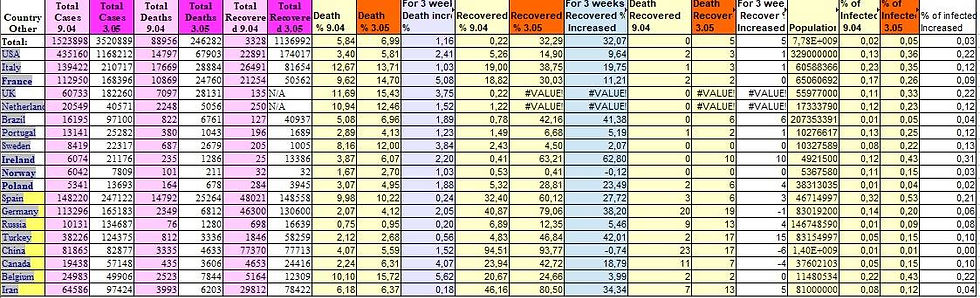
20200409, Excel view:

20200503:
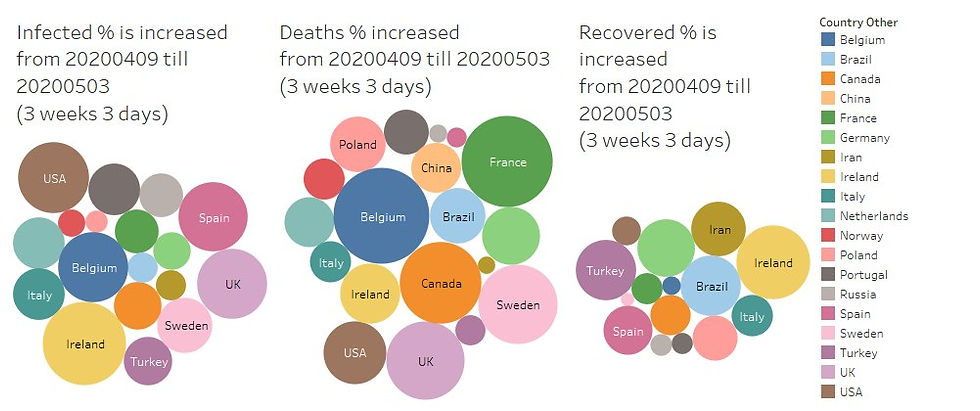
20200409 - 20200503 3 weeks comparison:
20200515:


Комментарии